Some useful information of OCV for missing data
wei wang
Last updated: 2018-02-11
Code version: dcd6356
software
R packages
library(ssvd)
library(PMA)
library(softImpute)
settings for the 5 data sets in our paper.
GTEx zsocre
library(R.matlab)
Y_centered = readMat("../data/output/missingdata/GTExZsocre/example.mat")
Y = Y_centered$Ycentered
MovieLens
library(methods)
library(R.matlab)
library(Matrix)
## run the code
ml100K_data = readRDS("../data/output/missingdata/MovieLens/scale_data.rds")
MLMatrix <- sparseMatrix(i = ml100K_data[,1],
                         j = ml100K_data[,2],
                         x = ml100K_data[,3],dims = c(943,1682))
# turn this sparse matrix into matrix in r
Y = as.matrix(MLMatrix)
Y[which(Y == 0)] = NA
# writeMat("~/HG/flash/data/OCVmissflashr2/ML100K_scaled/Ydata.mat", Y = Y)
denoiseR tumor data
library(R.matlab)
Y_centered = readMat("../data/output/missingdata/DenoiseRtumor/example.mat")
Y = Y_centered$Ycentered
denoiseR text data
library(R.matlab)
## run the code
Y_centered = readMat("../data/output/missingdata/DenoiseRtext/example.mat")
Y = Y_centered$Yscaled
Breast cancer data
library(R.matlab)
## run the code
Y_centered = readMat("../data/output/missingdata/BreastCancer/example.mat")
Y = Y_centered$Y
# in the matlab package of NSF, the use the centered data by rows
N = dim(Y)[1]
P = dim(Y)[2]
Y = Y - rowMeans(Y) %*% t(rep(1,P))
other experiments during the test
library(ggplot2)
plot_res = function(output,title = "data",legend_position = "none", x_label){
  rmse = as.vector(output)
  N = dim(output)[1]
  # methods = rep(c("flash","NBSFA","PMD","softImpute"), each = N)
  methods = rep(x_label, each = N)
  df = data.frame(RMSE = rmse, Method = methods )
  p<-ggplot(df, aes(x=Method, y=RMSE, color=Method)) +
  geom_boxplot()+
  # geom_violin()+
  ggtitle(title) +  theme_bw()+
    theme(legend.position= legend_position, legend.text=element_text(size=15), axis.text.y = element_text(size =6))
  p
}
x_label = c("flash","NBSFA","PMD","softImpute")
PT_res = readRDS("../data/missingvalue/OCVtemplate/RCCres/president_box.rds")
pp = plot_res(PT_res,"Text data",x_label = x_label)
DT_res = readRDS("../data/missingvalue/OCVtemplate/RCCres/denoiseRtumor_box.rds")
pd = plot_res(DT_res,"Tumor data",x_label = x_label)
GZ_res = readRDS("../data/missingvalue/OCVtemplate/RCCres/gtexzscore_box.rds")
pg = plot_res(GZ_res,"GTEx data",x_label = x_label)
BC_res = readRDS("../data/missingvalue/OCVtemplate/RCCres/BreastCancer_box.rds")
pb = plot_res(BC_res,"Breast Cancer data",x_label = x_label)
ML_res = readRDS("../data/missingvalue/OCVtemplate/RCCres/ML100K_box.rds")
ML_res[c(2,13,17,21,29,37,62,76,77,93,95,100),] = NA
ML_res = matrix(as.numeric(ML_res),ncol = 4)
pM = plot_res(ML_res,"Movie Lens data",x_label = x_label)
plots
gridExtra::grid.arrange(pp,pd,pg,pb,pM, layout_matrix = rbind(c(1,NA,2),c(NA,5,NA),c(4,NA,3)))Warning: Removed 48 rows containing non-finite values (stat_boxplot).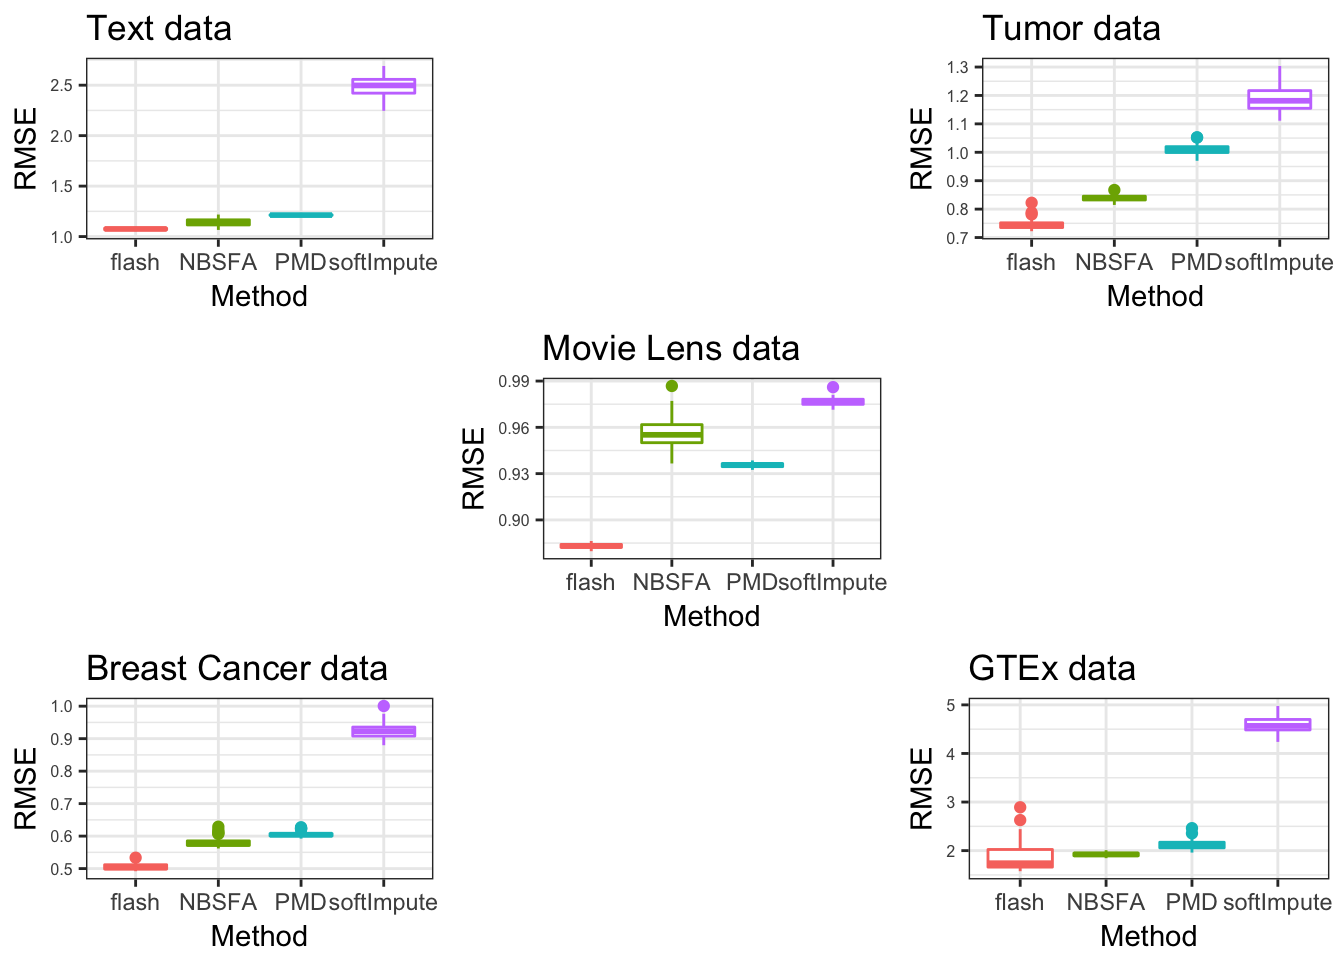
results for different tuning parameters
pmd_c = sapply(seq(1,10),function(x){paste("PMD",x)})
softImpute_c = sapply(seq(1,10),function(x){paste("SF",x)})
x_label= c("flash","NBSFA",pmd_c,softImpute_c)
PT_res = readRDS("../data/missingvalue/box_res_grids_sf_pmd/denoiseTumor_box.rds")
pt = plot_res(PT_res,"Tumor data",x_label = x_label)
pt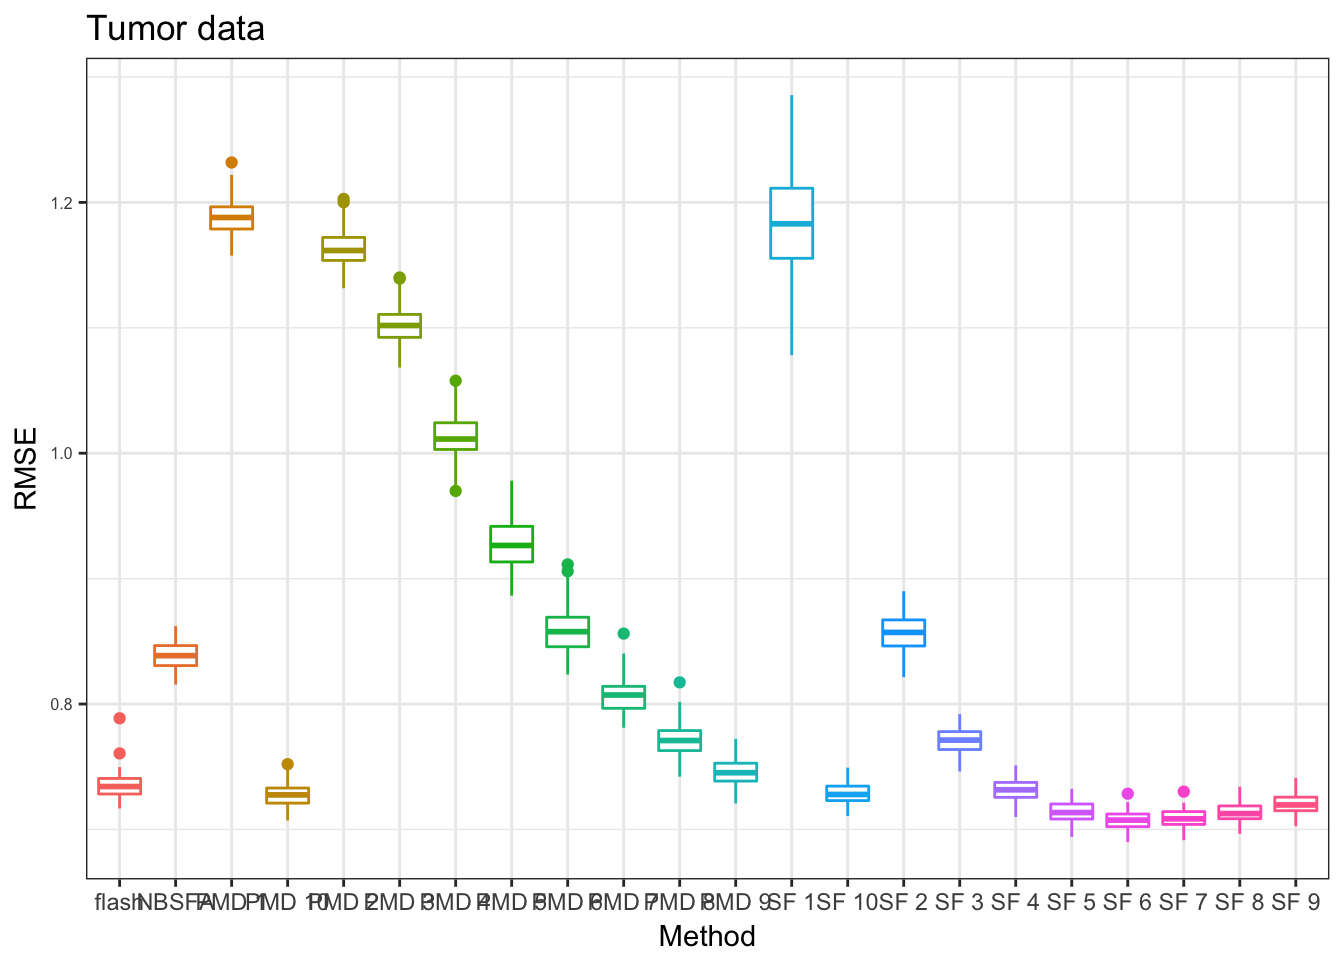
PT_res = readRDS("../data/missingvalue/box_res_grids_sf_pmd/TEXT_prsdt_box.rds")
pp = plot_res(PT_res,"Text data",x_label = x_label)
pp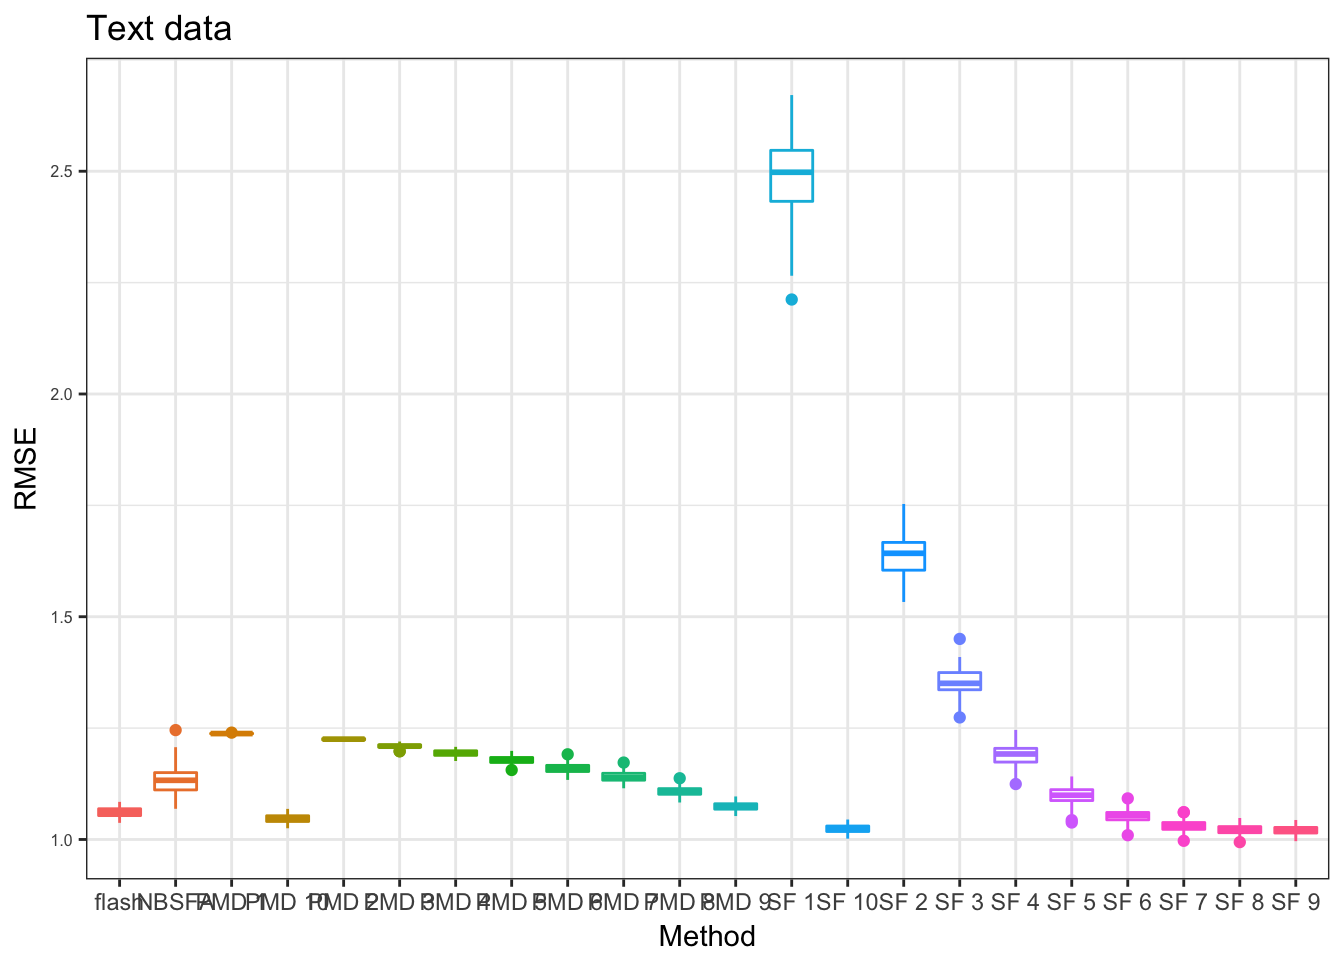
use OCV choose the tuning parameters
| labels | null check | backfitting | greedy | ebnm_ash | ebnm_pn |
|---|---|---|---|---|---|
| flashG | yes | yes | yes | ||
| flashGwn | yes | yes | |||
| flashB | yes | yes | yes | ||
| PN | yes | yes | yes |
Breast Cancer data
we use 10 grids for softImpute and PMD
PB_res = readRDS("../data/missingvalue/testingcode/box_Breast.rds")
x_label= c("PN","flashG","flashGwn","flashB","nsfa","pmd","soft")
pb = plot_res(PB_res,"Breast Cancer data",x_label = x_label)
pb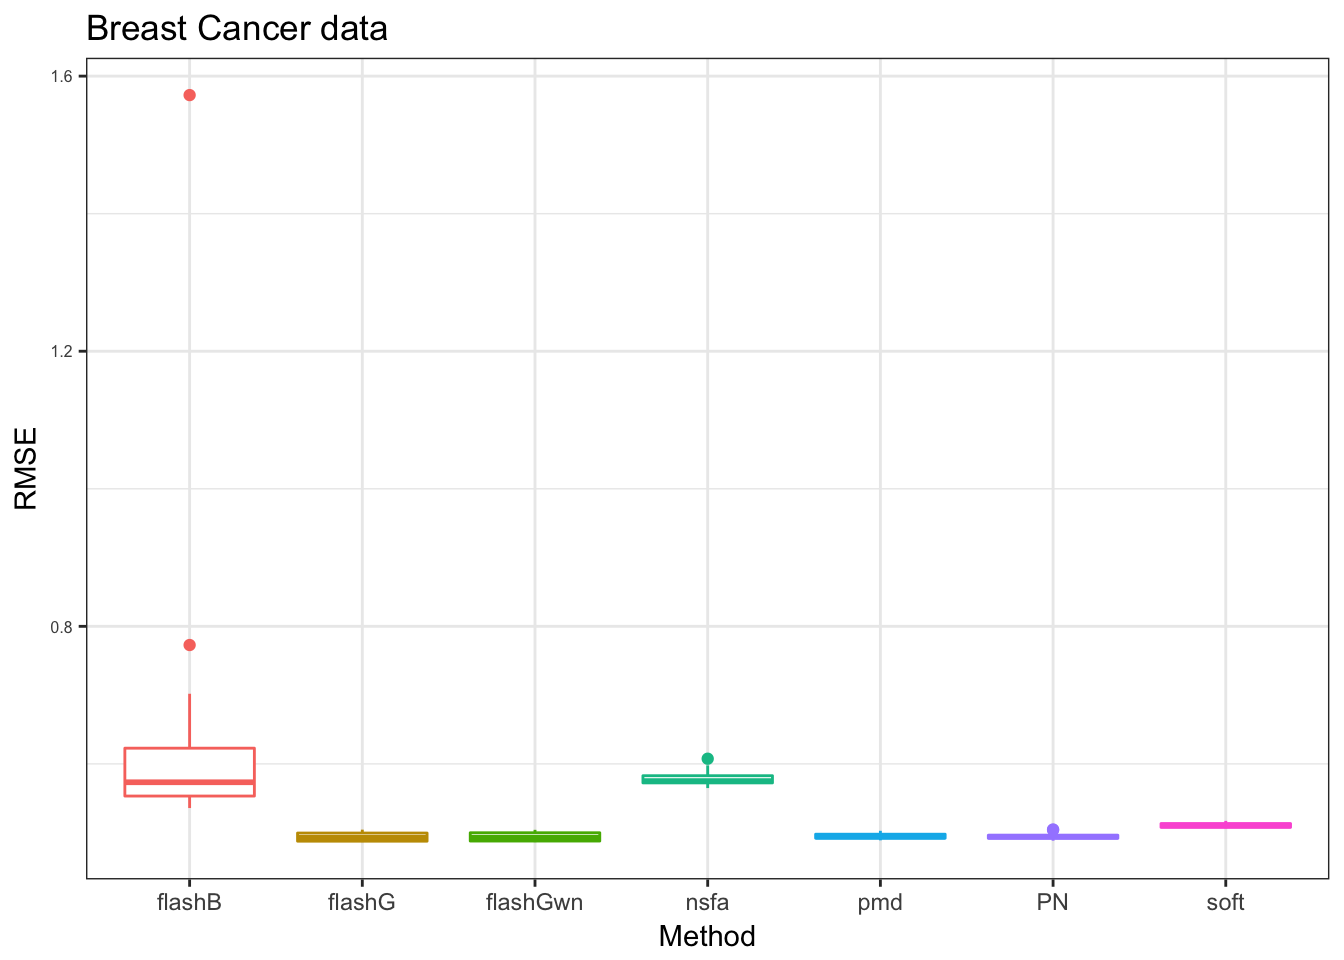
we take the ‘flashB’ away to compare the rest.
x_label= c("PN","flashG","flashGwn","nsfa","pmd","soft")
pb = plot_res(PB_res[,-4],"Breast Cancer data",x_label = x_label)
pb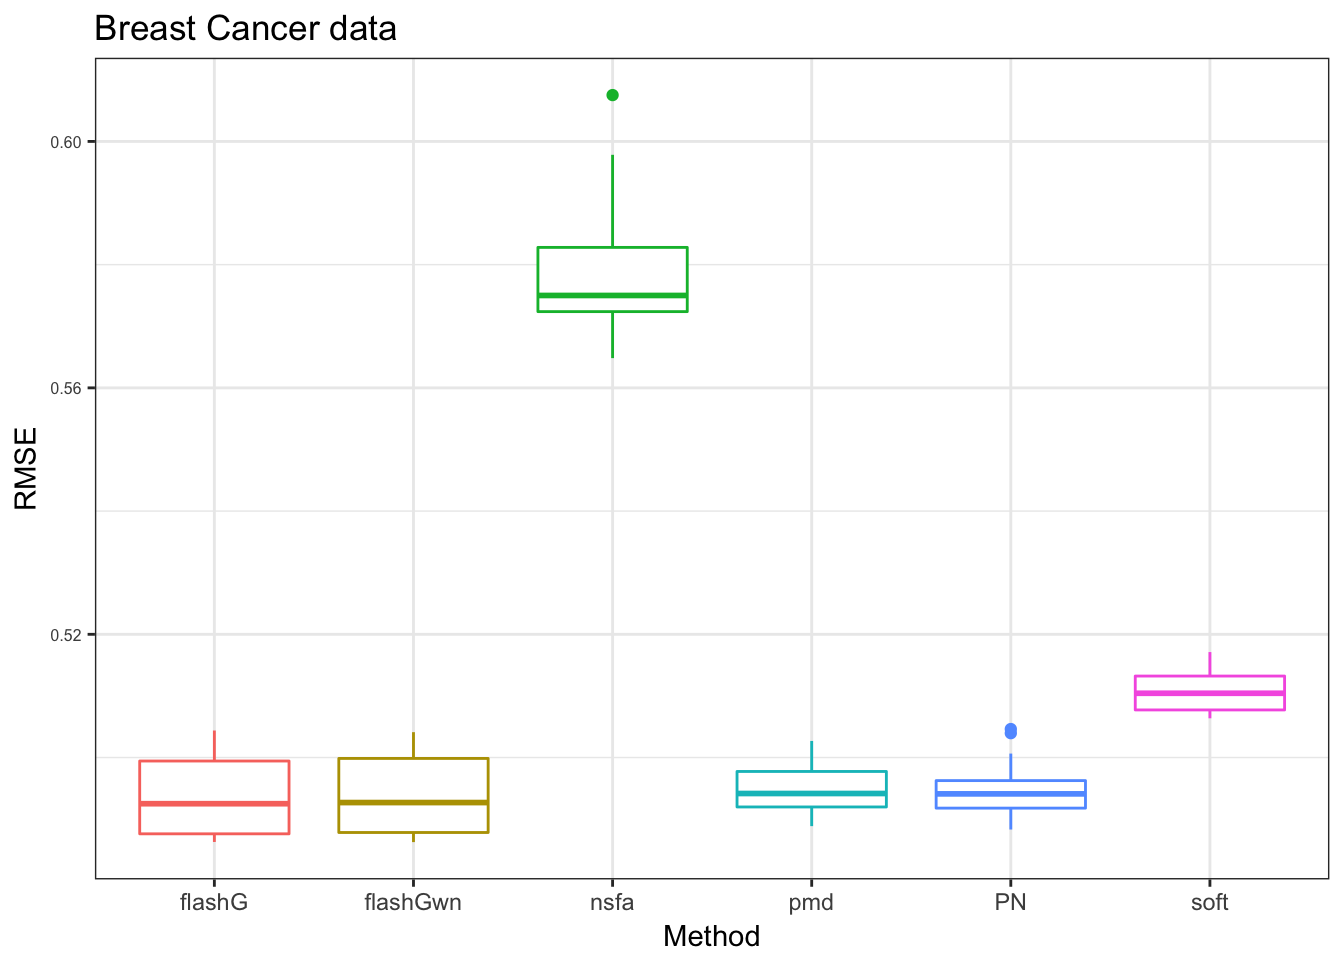
denoiseR Tumor data
we use 10 grids for softImpute and PMD
PT_res = readRDS("../data/missingvalue/testingcode/box_denoiseTumor.rds")
x_label= c("PN","flashG","flashGwn","flashB","nsfa","pmd","soft")
pt = plot_res(PT_res,"Tumor data",x_label = x_label)
pt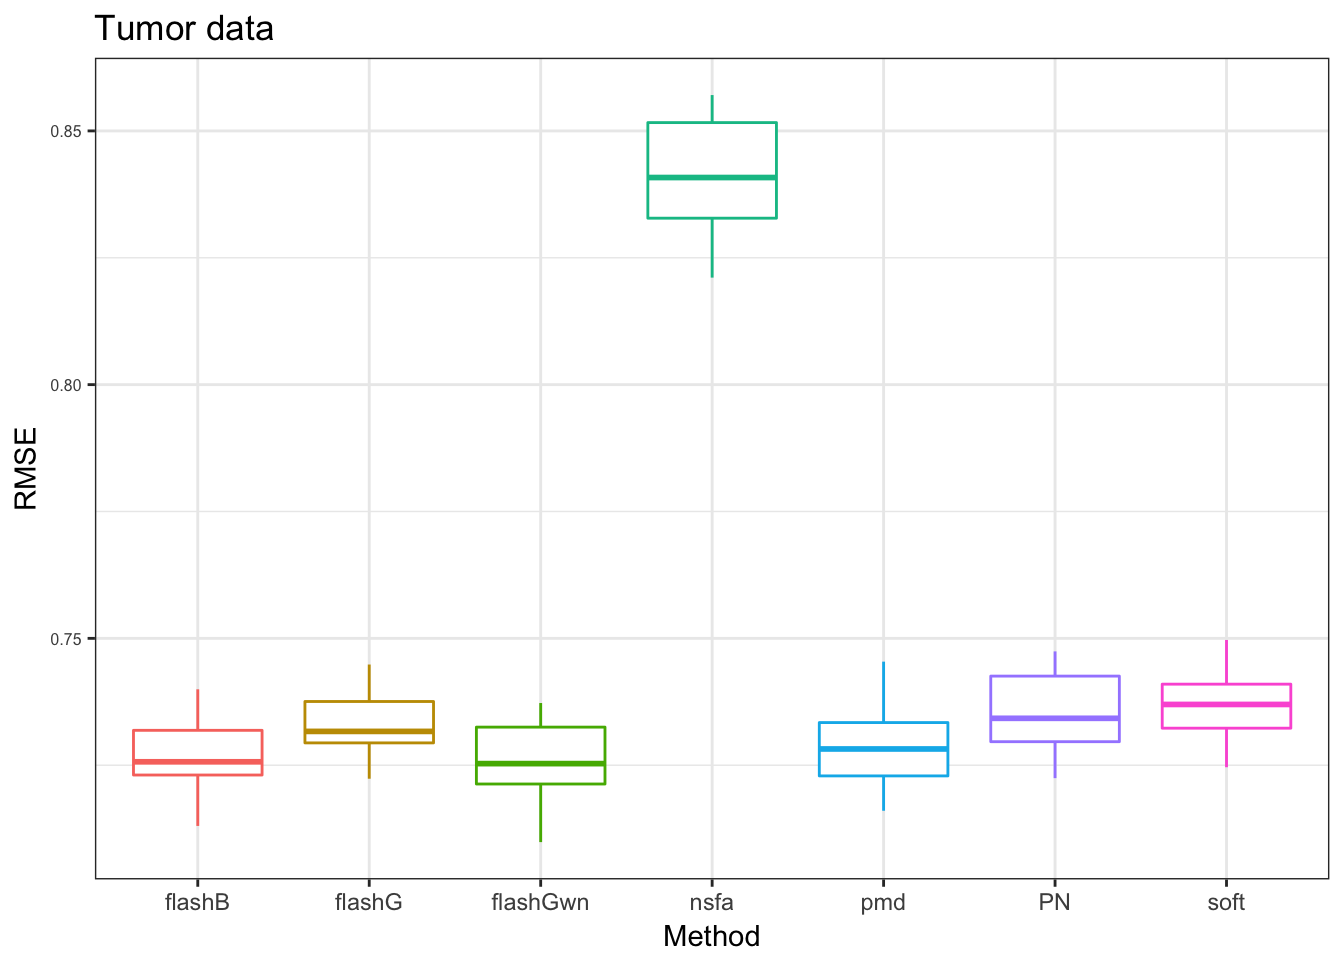
text data
in this data, we add zero as use zero values as imputation to compare with other methods.
PT_res = readRDS("../data/missingvalue/testingcode/box_president.rds")
x_label= c("PN","flashG","flashGwn","flashB","nsfa","pmd","soft","zero")
pt = plot_res(PT_res,"Text data",x_label = x_label)
pt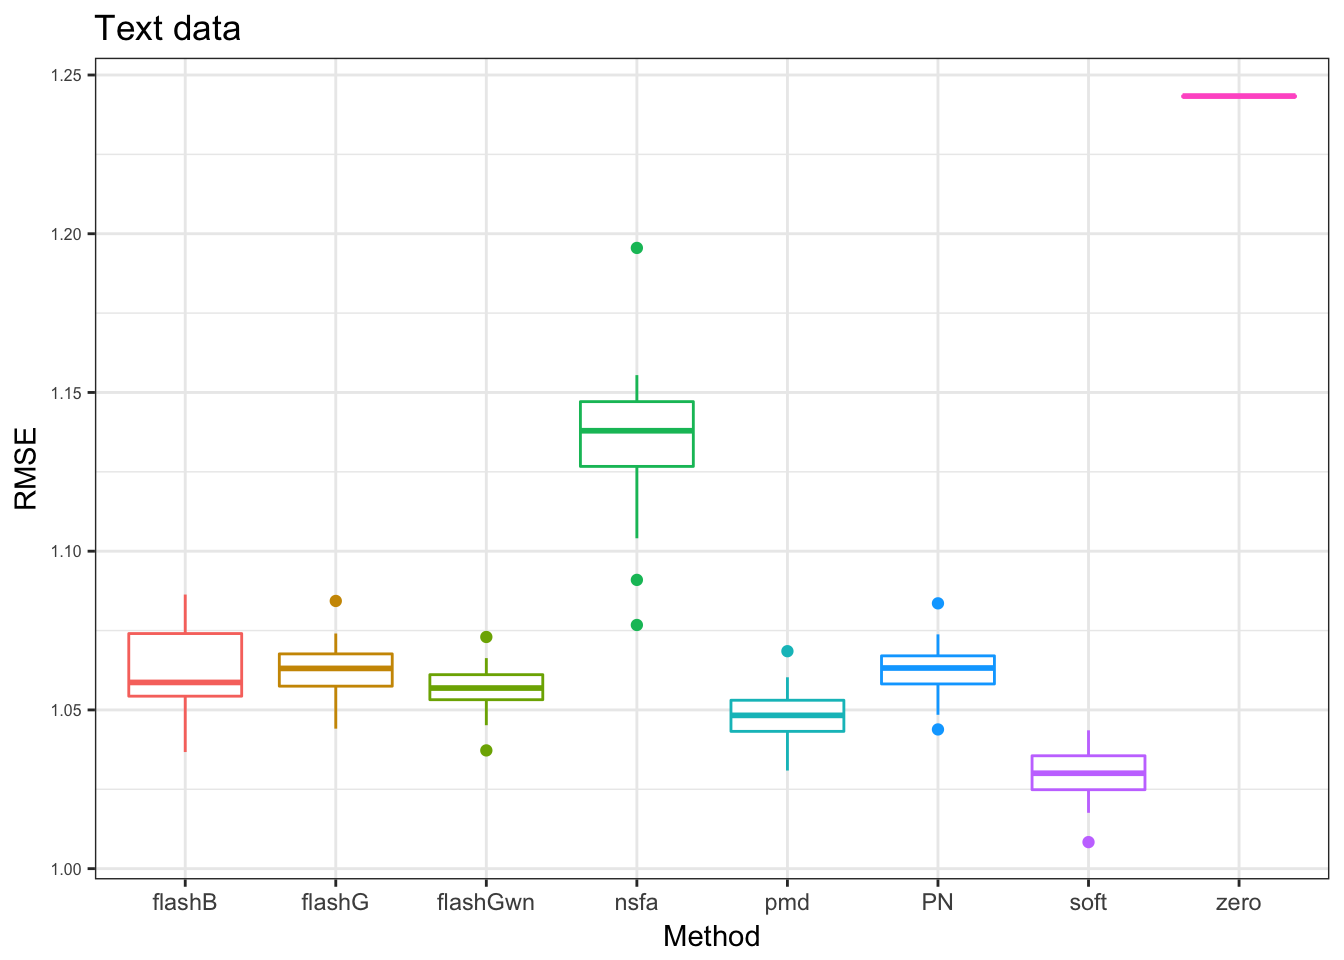
Session information
sessionInfo()R version 3.3.0 (2016-05-03)
Platform: x86_64-apple-darwin13.4.0 (64-bit)
Running under: OS X 10.13.3 (unknown)
locale:
[1] en_US.UTF-8/en_US.UTF-8/en_US.UTF-8/C/en_US.UTF-8/en_US.UTF-8
attached base packages:
[1] stats graphics grDevices utils datasets methods base
other attached packages:
[1] denoiseR_1.0 scales_0.4.1 MASS_7.3-47 reshape2_1.4.3
[5] flashr_0.4-6 workflowr_0.4.0 rmarkdown_1.6 ggplot2_2.2.1
[9] R.matlab_3.6.1 softImpute_1.4 Matrix_1.2-11 PMA_1.0.9
[13] impute_1.48.0 plyr_1.8.4 ssvd_1.0
loaded via a namespace (and not attached):
[1] ashr_2.2-3 lattice_0.20-35 colorspace_1.3-2
[4] htmltools_0.3.6 yaml_2.1.16 rlang_0.1.6
[7] R.oo_1.21.0 withr_2.1.1 R.utils_2.5.0
[10] foreach_1.4.4 stringr_1.2.0 munsell_0.4.3
[13] gtable_0.2.0 R.methodsS3_1.7.1 devtools_1.13.3
[16] codetools_0.2-15 leaps_3.0 evaluate_0.10.1
[19] memoise_1.1.0 labeling_0.3 knitr_1.18
[22] pscl_1.5.2 doParallel_1.0.11 irlba_2.2.1
[25] parallel_3.3.0 curl_2.8.1 Rcpp_0.12.14
[28] flashClust_1.01-2 backports_1.1.2 scatterplot3d_0.3-40
[31] truncnorm_1.0-7 gridExtra_2.3 digest_0.6.13
[34] stringi_1.1.6 flashr2_0.4-0 grid_3.3.0
[37] rprojroot_1.2 tools_3.3.0 magrittr_1.5
[40] lazyeval_0.2.0 tibble_1.3.4 cluster_2.0.6
[43] FactoMineR_1.36 SQUAREM_2017.10-1 httr_1.3.0
[46] rstudioapi_0.6 iterators_1.0.9 R6_2.2.2
[49] git2r_0.19.0 This R Markdown site was created with workflowr